
covid-svelte-sciencey
Find the GitHub code here. See the completed covid-svelte-sciencey dashboard here.

After doing the covid-dash-sciencey post a while back, my desire to learn front end web coding to make cool interactive dashboards had just begun! Python and Dash were cool, and were relatively easy, but I had a desire to go straight to the source – Javascript! I had completed several certifications in front end programming (html/css/javascript) through Free Code Camp.
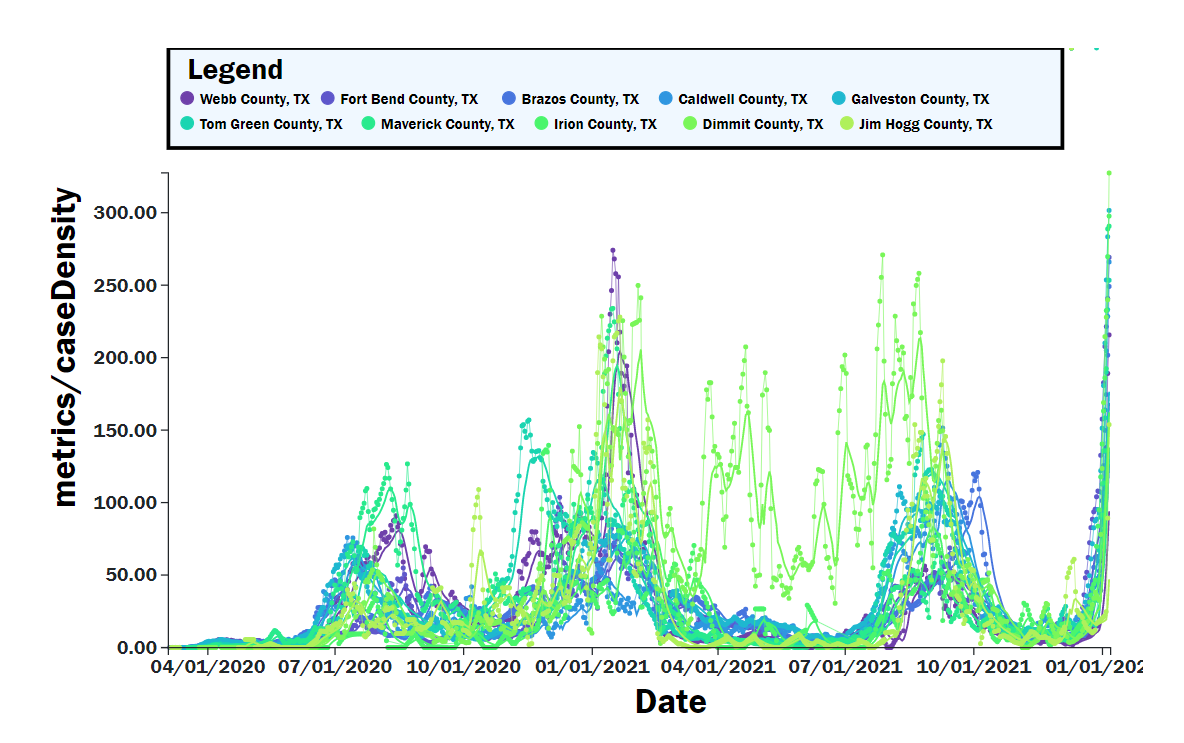
After completing the course projects, I spent some time building out a Covid Dashboard using API data from https://covidactnow.org/, a very good website with a free and open API. The code is really an extension of the D3.js (data visualization course on free code camp), which is a powerful graphics library for creating interactive visualizations within web browsers from data. See some examples above. I was also able to use several svelte components (sveltestrap, svelte-multiselect, gridjs-svelte), which were easy to implement and not too difficult to track down on Google.